Nspire Stat Logo Main Page MathBits.com Table of Contents MathBits.com Terms of Use TI-84+ Web Site

Scores
Frequency
65
2
70
3
75
2
80
5
85
8
90
7
95
5
100
3

Mean, Mode, Median with Grouped Data

Find the mean, median and mode for this grouped data of test scores.

pointing lady
This problem can certainly be solved by entering ALL 35 scores into one list, with 65 appearing twice, 70 appearing 3 times, and so on.  Dealing with the data's frequencies, however, may accomplish the task more quickly.

Method 1:

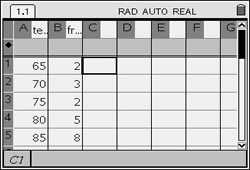
Enter the data into two lists (spreadsheet).

Enter the data on a List & Spreadsheet Page.
Label column A to be "test" (or any name you choose).
Label column B to be "freq" (for the frequency).

(See Lists and Spreadsheets for entering data.)

MMM Grouped 1

Find the Mean:

Open a Calculator Page.
Press homekey and choose #1 Calculator. Hit ENTER.
Press Catalog (Catalog), then M, and choose mean( or median(.

This time we will tell the calculator the list containing the scores followed by the list containing the frequencies.  Notice the comma separating the lists.

The mean is 85.

MMM Grouped 3
Syntax: mean(List[, freqList[ )
If each data entry is to be considered only once, the freqList[ is one and need not be entered.
In this example, howeer, we entered the name of the list containing the frequencies as the second entry.

Find the Median: The calculator's median command will not accept frequency values. You will have to find the median by visually examining the chart. Count the total number of scores and find the median. Since the data in the chart is occurring in ascending order, we simply need to see where the middle of the scores is occurring.

There are 35 scores. Half of 35 is 17.5, from which we can determine that the "middle score" must be the 18th score, with 17 scores on either side of it. The median is the 18th score.
Counting from the top down, the 18th score occurs in the 85 score category.

The median is 85.

Find the Mode:
The mode can be quickly determined by examining the chart to see which score occurred most often.  No calculator work needed.

The mode is 85.

Method 2:

Enter the data into two lists (spreadsheet).

Enter the data on a List & Spreadsheet Page.
Label column A to be "test" (or any name you choose).
Label column B to be "freq" (for the frequency).

(See Lists and Spreadsheets for entering data.)

MMM Grouped 1
The One Variable Statistics option will allow for the entry of frequencies of data.

Press MENU, #4 Statistics, #1 Stat Calculations, and choose #1 One-Variable Statistics.

Notice how the frequency list, freq, is used in the set up at the right.

Read off the Mean and the Median from the list of information:

MEAN mean symbol
Mean MMM
MEDIANmedian MMM


Menu Choices

Menu Choice

When prompted for number of lists, enter 1.

grouped

Under "Frequency List:" enter freg.

Find the Mode:
The mode can be quickly determined by examining the chart to see which score occurred most often.  No calculator work needed. The mode is 85.


Table of Contents | MathBits.com | Terms of Use