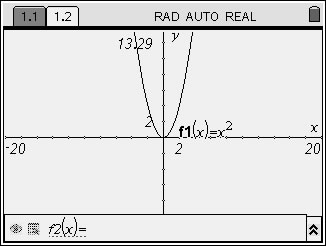
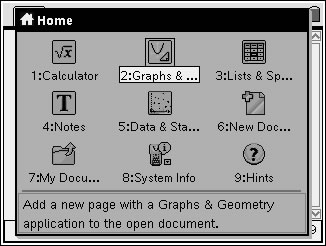
To insert a page for graphs, choose option #2 Graphs & Geometry from the HOME screen or press CTRL I (to choose the insertion of a graph page). Notice that the Standard Window (shown above) is not the familiar 10 x 10 window we saw on the TI-83+/84+. On the TI-Nspire, the aspect ratio is maintained and the tick marks of two units are of equal length on both axes.
Pressing MENU will display many familiar graphing options (such as Window and Trace) as well as some new and exciting choices.
The arrows at the right of each option indicate that there is more information waiting to be seen.
Use the NavPad arrows to move around these menus.
|
|
Example: Let's look at the graph of the classic parabola  . .
|
Use TAB and ESC to move between the graph and the f(x) entry area. |
|
Use your TAB key to enter the function.
Press ENTER.
Notice how the graph is automatically
labeled on the grid as f1(x).

|
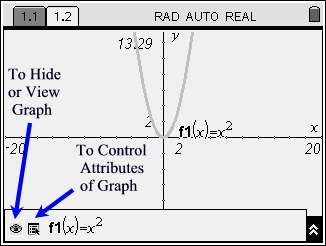
You can HIDE a graph
and/or control its ATTRIBUTES
(
width, continuity, labeling ...)
by using the icons to the left of f1(x).
 |
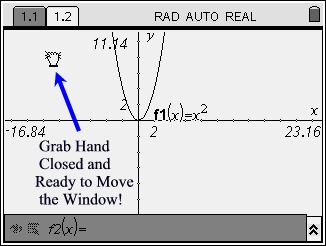
While you can use the WINDOW option
to change your view of a graph, you can also
use the "grab hand".
Move your pointer to a
clear area of the screen.
Hold down the CLICK KEY
until the "grab hand" appears closed.
Now, move the graph until you get the desired view.

|
Tidbits of Info:
ATTRIBUTES can also be controlled by using
MENU #2 ATTRIBUTES.
CTRL - G will hide the command line
(Hit it a second time to reinstate the line.)
CTRL- ESC to undo something.
|
|
|


![]()